Publications
 Partners


Dawie Scholtz is a self-admitted elections wonk. As a student studying international relations, economics and management consulting he immersed himself in electoral politics and went to work for the DA as a pollster after completing his university studies.
Today, in the hurly-burly of high finance where he now works, he has established himself as one of the more considered analysts traversing the minefield of political analysis.
And he's attracted quite a Twitter following with his incisive dissection of political shifts and electoral tumult. He's one of the few analysts around who keep a close eye on by-elections and what they signal about changing voting patterns and perceptions.
But what sets Scholtz apart from most is his use of data analytics and mathematical models in analysing possible election outcomes. South Africa has rich data sets available about voters, demographics, geography and historical voting patterns and in the hands of a whizz like Scholtz they become powerful tools in attempting to clear the fog. Today we publish Scholtz's analysis of possible voting outcomes. It does not represent a formal prediction, he warns, and says the results are "best-guess estimates based on an analysis of historic voting and turnout patterns, combined with the latest registration figures, insights from recent by-elections and polling".
His analysis is not based on formal polling, like that done by the Institute of Race Relations or Ipsos. "The purpose of this exercise is to produce an expected range of possible outcomes using 'best guesses' for a number of unknown variables," he says.
There are seven weeks left before the country goes to the polls on May 8, and many things can still change that could affect the final outcome. Calamities like the ongoing blackouts, for example, will surely have a significant impact on the final numbers.
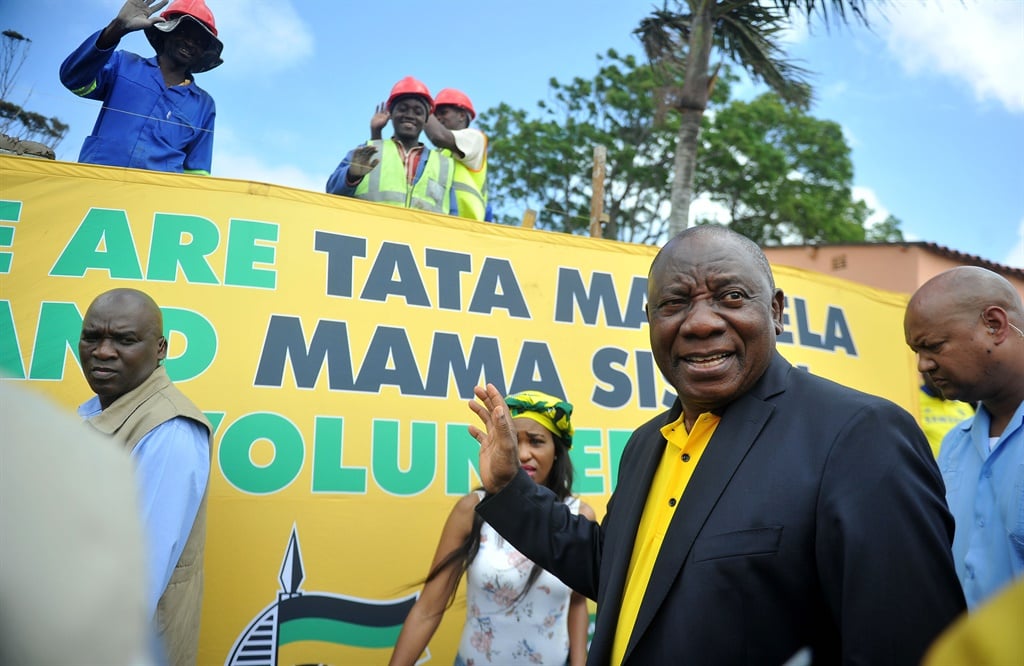
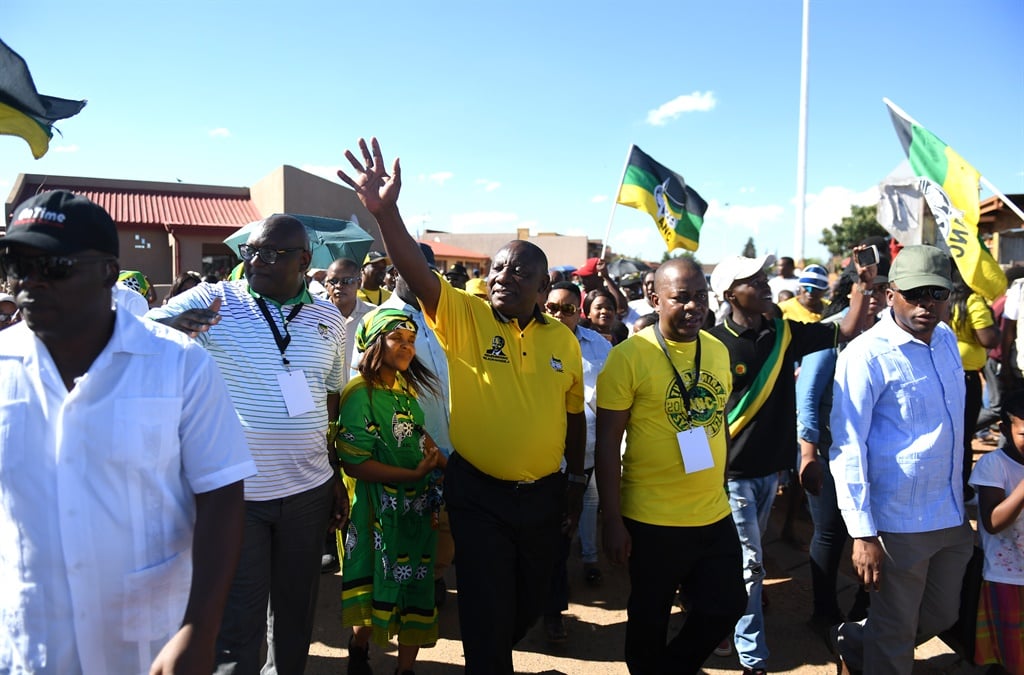
Scholtz believes the ANC will win…but with a reduced majority. And the opposition landscape will also change significantly, according to his modelling. Read on for his analysis. – Pieter du Toit
High-level national expectation
With current best-guess assumptions the model produces an expected outcome of:
ANC: 58
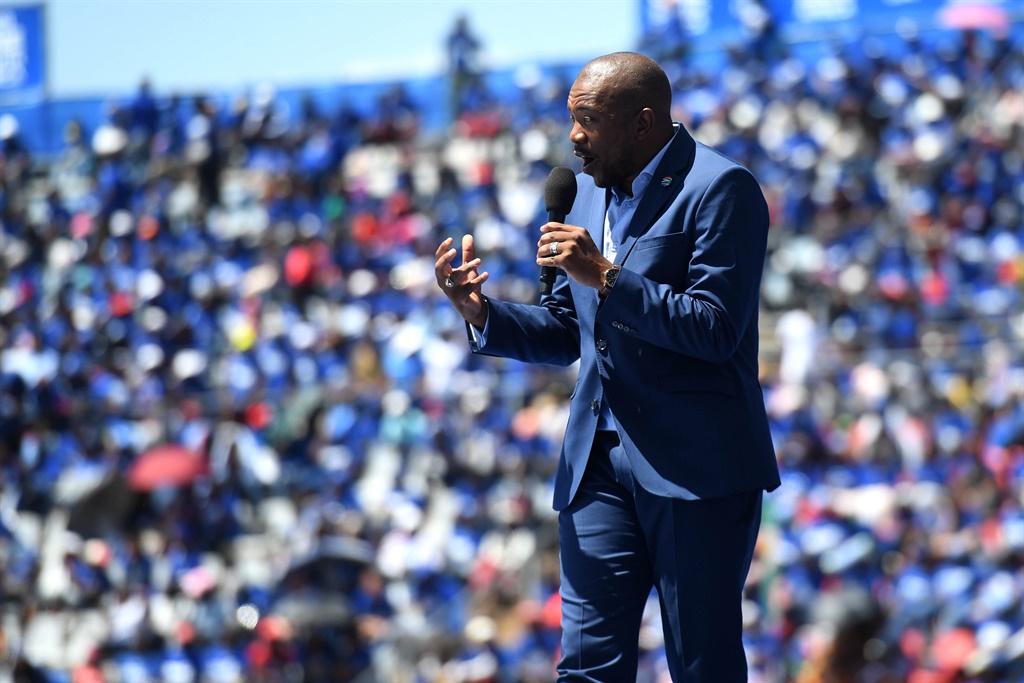
DA: 23
EFF: 10
Of course, the precise numbers here are not the key fact. The likely range of expectations is a more important indicator. The model currently has the most likely range of outcomes (in percentages) at:
ANC: 56-60
DA: 21-24
EFF: 9-12
And beyond this most-likely central range, the model also produces a secondary range, with the extremes of the ranges less likely, but still plausible. The wider-range estimates are:
ANC: 55-61
DA: 20-25
EFF: 8-13
Results beyond these ranges would require dramatic shifts in the turnout and voting patterns that have to date not been suggested by credible public polling or recent by-elections.
Of course, as campaigning proceeds and events emerge it is entirely possible that surprising turnout or voting pattern shifts that upend these expectations might take place. The emerging load shedding crisis might be one such factor that has the ability to change turnout and voting patterns in a way that upends the model's current expectations. At this stage we, however, have no hard data to predict how load shedding may affect the election.
Drivers of the election outcome: Turnout and the black voting pattern
Driver 1: Turnout
The turnout pattern on May 8 will be crucial to determining the outcome of the election. The critical turnout metric is the relative level of turnout in townships as compared to turnout in suburban areas. In recent elections, the DA has succeeded in driving turnout in suburban areas to disproportionately high levels.
The statistics for recent elections are as follows:
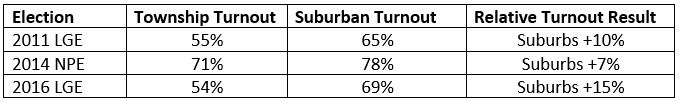
When disproportionate turnout occurs in particular areas (like suburbs), it inflates those voters' overall impact on the election results and in the case of 2011, 2014 and 2016, it aided the DA.
The relative turnout result will be critical to the outcome in the 2019 election.
The model currently assumes a relative turnout level of +7% for suburbs again in 2019. (In other words, a repetition of the 2014 relative turnout pattern.) If, however, this were to change in either direction, it will have a significant impact on the result.
At this stage there is no clear data available to predict turnout very accurately and polling has been inconclusive on this matter. Registration patterns in the recent registration weekend, however, suggest a relative turnout advantage for suburbs in the 7-10% range. It is however difficult to extrapolate this directly to the likely turnout pattern for the actual election.
Driver 2: The black voting pattern
In the last three elections, black voters started moving away from the ANC. This is summarised in the table below:
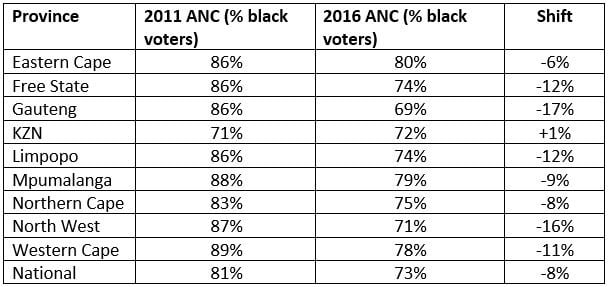
This rapid decline was the key driver of the ANC's poor performance in the 2016 local government election.
Today, there is significant uncertainty about the extent to which President Cyril Ramaphosa is able to claw back ANC support lost in the black electorate in the last 10 years. At this stage, the model assumes modest improvements for the ANC on the 2016 voting pattern in the black electorate.
If the ANC's recovery exceeds expectations, or if the party does not recover from its 2016 showing, the election result could be altered significantly. The exact breakdown of DA and EFF support within the black electorate is also critical for those parties' outcomes.
Conclusion
This election is unprecedented in its uncertainty and unpredictability. There is a large number of voters who are currently "soft" in their choice or still undecided – that could still shift as the campaign unfolds. These best-guess estimates are therefore provided, given what we know now. The expectations can easily be altered or upended if drastic events occur in the next 50 days leading up to the elections. The risk of persistent load shedding appears to be one such factor that might or might not upend expectations.